

ABSTRACT
The BioDOF-Map framework is an online tool specifically developed for the purpose of mapping and monitoring fisheries operations in Malaysia. Accessible through internet browsers such as Google Chrome and Mozilla Firefox, this software enhances the performance of remote sensing and Geographic Information System (GIS) technologies in the field of agriculture management. The development of the system was initiated subsequent to the signing of a Memorandum of Understanding (MoU) between the Department of Fisheries (DOF) and the Malaysian Space Agency on November 27, 2018. The BioDOF-Map has five essential parts. The first module is a comprehensive resource on aquaculture farms in Malaysia. The second module provides extensive and precise search capabilities, including farm locations and fish health status. The third module is a data editing capability designed for administrators to modify data in real-time. The fourth module quantifies the dimensions of farms and the distances between different sites, while the fifth module allows users to generate and save data as tables or maps in formats such as PDF and TIFF images. The software is compatible with smartphones and tablets running Android, iOS, and Windows operating systems. In addition, BioDOF-Map incorporates a dashboard functionality that enables real-time illness monitoring, alerting personnel of fish health problems. It facilitates future growth by using modular analytical modules. The system improves decision-making, decreases human resource needs, and yields crucial data for stakeholders in fisheries, aquaculture, and disease management by simplifying access to both spatial and non-spatial data.
KEYWORDS : BioDOF-Map, Web-based system, aquaculture breeder, ornamental fish
INTRODUCTION
Biosecurity issues include disease outbreaks, invasive species, and ecological changes pose difficulties to the worldwide fisheries sector, which is a crucial pillar of food security and sustains millions of livelihoods. Traditional biosecurity measures frequently prove inadequate in effectively managing these intricate hazards, resulting in substantial economic and environmental consequences. In addressing these challenges, Web-based Geographic Information Systems (WebGIS) have emerged as indispensable instruments. WebGIS enables users to retrieve spatial data, carry out sophisticated cartography, and participate in spatial analysis using widely used web browsers such as Chrome, Firefox, and Internet Explorer. A prime example of WebGIS in the field of fisheries management is the BioDOF-Map system, which operates on Android, iOS, and Windows computer platforms. It optimises communication by using five essential modules: summaries of aquaculture farms, search capabilities for specified criteria, real-time data editing, measurement of farm area, and the capability to export analytical results in PDF and TIFF formats. The technology guarantees the provision of secure access to confidential data effectively controlled by administrators. The scalable architecture of the system facilitates the creation of bespoke GIS applications. Through the integration of vital fisheries and aquaculture data, BioDOF-Map, enabled by ArcGIS Server, assists the Department of Fisheries (DOF) in planning, resource management, and enhancing decision-making in biosecurity control.
MATERIALS AND METHODS
The application of GIS technology is crucial because information about its design and development cannot be established without a careful evaluation of the geographical and temporal relationships of climate data. GIS is distinguished from other information technology advancements in that it provides the user with a variety of capabilities to evaluate and link spatial data. Malaysian Space Agency (MYSA) has acquired a server and ArcGIS server software (MYSA). MYSA is responsible for developing the interface system, which, upon completion, will be delivered to the Department of Fisheries (DOF) for updating and maintenance. The system was designed and created to offer DOF Malaysia an interactive GIS web-based application. The application is built upon the Arc GIS Server and Arc GIS Viewer for Flex. GIS services are provided on the ArcGIS Server platform. A service refers to a geographical resource that is provided to client applications, such as a map, locator, or geodatabase API. In addition to service extensions and capabilities, ArcGIS Server has the ability to host a wide range of web service types. GIS Services encompass cached and dynamic map services, geodata services, geocode services, geoprocessing services, and image services. Hence, ArcGIS Server is essential for creating, managing, and presenting GIS online data to support desktop, mobile, and web-based mapping applications.
RESULTS AND DISCUSSION
Furthermore, customers intending to utilise this system must adhere to certain minimal criteria of the system. It is recommended that users use internet speeds exceeding 520Kbps. An optimal computer resolution for effectively navigating the system is 1024 x 768 pixels. The present study has identified that the BioDOF-Map system comprises five distinct modules, namely view, search, edit, measurement, and tools. Access to the system will be restricted to registered users only. The login authentication system is a ubiquitous feature in web applications, essential for ensuring security. Authenticated users are granted access to the website and exclusive features reserved for members. Additionally beneficial is the fact that it facilitates the storage of information for consumers (Figure 1).
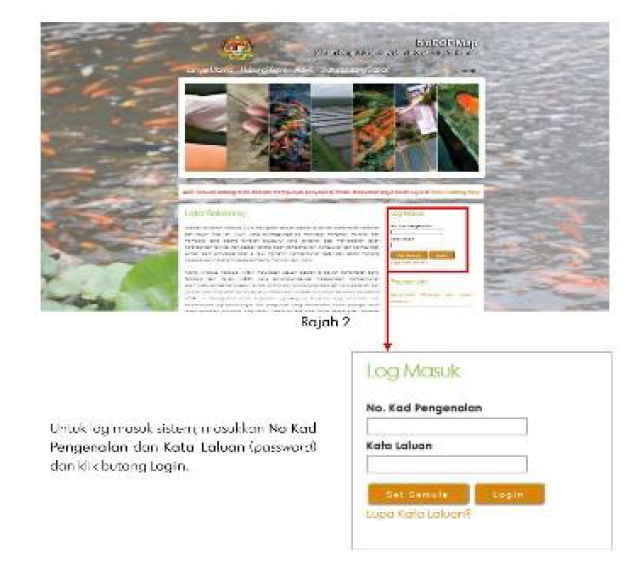
Figure 1: Login to the BioDOF-Map system using by entering username and password.
The initial module allows visualisation of the geographical positions of fish farms within the system. User access is granted to access the system for the purpose of collecting information from designated farm facilities. Within the system, spatial data can be categorised into two distinct types: fundamental information and aquaculture farms information (Figure 2). Additional functionalities, including zoom in, zoom out, home, my location, pan, full view, and bookmark (Figure 3), have been included to enhance the user browsing experience.
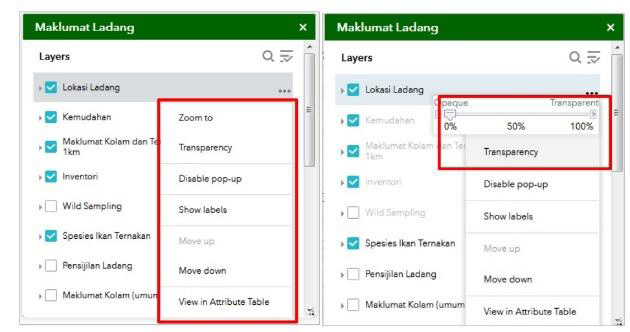
Figure 2 : Distribution of fish farms in the system, table of basic information and aquaculture farms information.
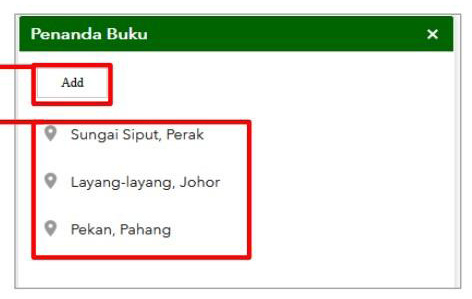
Figure 3 : Bookmark
The second module was partitioned into two search categories: broad search, including farm location and fish disease (Figure 4), and particular search, including latitude and longitude coordinates (Figure 5). The third Module is a data editing widget that allows the administrator to modify the data in the system. This widget is exclusively designed to help users understand the map’s information accurately, enhancing its usability and effectiveness. (Figure 6).
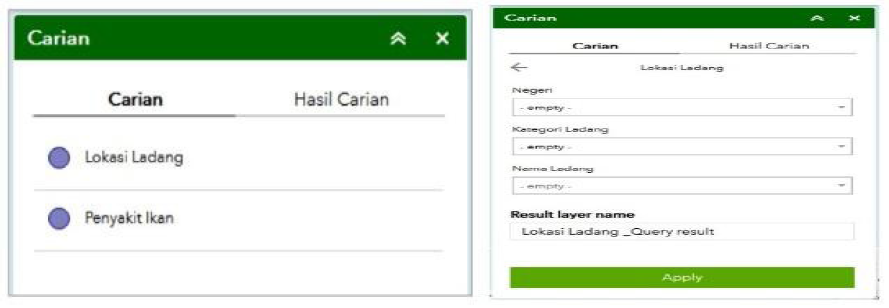
Figure 4 and Figure 5 : General search and specific search.
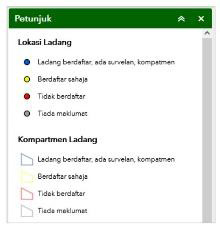
Figure 6 : Legend widget
The Fourth Module encompasses a measuring widget that enables the administrator to quantify the dimensions of a farm or a region, allowing for measurements between two specified locations (Figure 7). An essential measurement technique in mapping operations is the measurement of the distance between settlements and selected farm locations. This technique can greatly assist in Network Analysis.
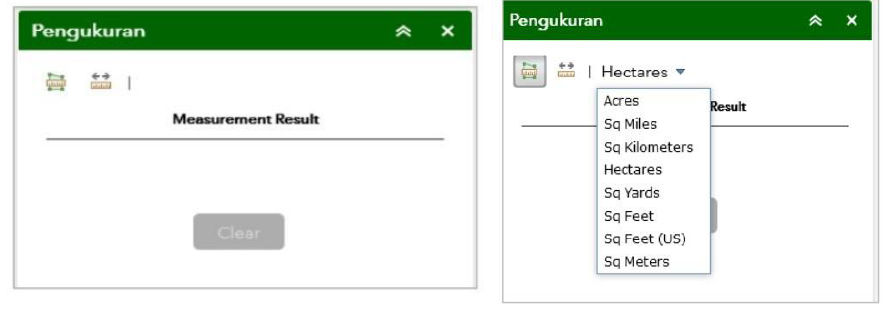
Figure 7 : Measurement widget
The final module pertains to the printing widgets, which enable the storage and printing of analysis findings in the form of tables and maps (Figure 8). Furthermore, this system also enables the user to choose the preferred basemap gallery type for the purpose of displaying different visuals (Figure 9).
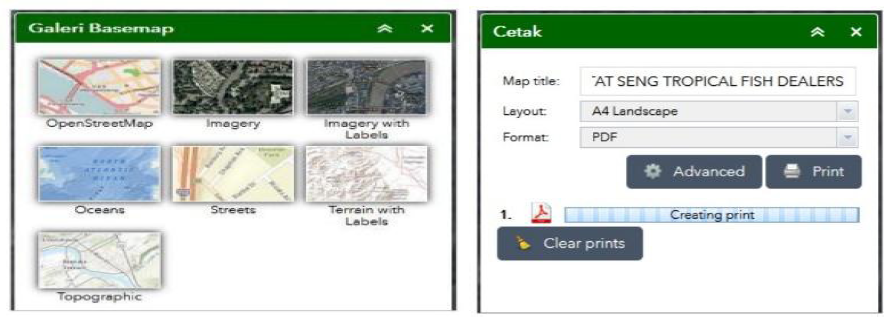
Figure 8 : Printing result from system. Figure 9 : Basemap Gallery option
GIS is a computing system that handles the collection, storage, and retrieval of geographical information, both with and without a specific location on the Earth. It also handles other data that is considered relevant to this information and enables rapid analysis of the results. There are two primary techniques for data acquisition: Primary data sources refer to digital datasets generated exclusively for use in a GIS project, while secondary data sources encompass digital and analogue datasets originally collected for a different purpose and need to be converted into a suitable digital format for GIS project use. Employing software tools like the edit widget within the system to accurately modify GIS data and its related metadata is the most precise approach for achieving this. Data collecting techniques employed for Geographic Information Systems (GIS) are limited. Geovisualization refers to the presentation of spatial data with the aim of enhancing the understanding of observable and simulated information, therefore enabling perception of the surface and internal processes of the Earth (Smith et al., 2022). One other mobile and user-centric application is Location-Based Services (LBS). The manipulator facilitates the device’s ability to determine its position on the map. If this positioning is inaccurate, the user can intervene to establish the accurate location. Volunteered Geographic Information (VGI) is a novel application that enables everyone with a smartphone to contribute geographical data, therefore augmenting our understanding of any given space. This phenomenon is facilitated through social media platforms (Elwood et al., 2012). The inclusion of connectors for widely used sensors, such as GPS devices installed in vehicles and mobile device manufacturers, allows the programs to establish connections with any type of sensor. The software enables users to utilise real-time data within GIS applications. It has the ability to connect with conventional sensors and inputs, such as GPS devices and mobile phones available in vehicles, and offers a remarkable range of filters and analytical capabilities that operate in real-time. The customer develops the distinctive capacity to perceive and react efficiently to the critically significant dates, locations, and limitations for client tasks. In the context of field prospection, which refers to the identification and documentation of recently developed aquaculture farm locations on a regional level, there exists a wide range of technologies and applications which are now accessible. Since 2013 (Buławka & Chyla, 2020), the generation of diverse software for tablets and smartphones has emerged as a primary area of concentration for technologists. The new technologies and software enhanced the accuracy of on-site estimates and simplified office tasks (Campana, 2016). By employing and presenting across smartphones, tablets, and watches, the application may adjust to the latest technological advancements. Wireless technology is the common term used to describe the communication networks of these devices. Their purpose is to enable the exchange of voice, data, and applications among mobile devices (mobile apps). tablets and smartphones are equally suitable for use with GIS technologies. Yet, the effectiveness of a mobile GIS depends mostly on three elements: geographical capabilities, user interface design, and system performance (Wibisono et al., 2020). The BioDOF-Map system in Malaysia’s fisheries sector facilitates streamlined data retrieval and update, encompassing farm and disease information, while also enabling real-time disease monitoring by state authorities. Proposed future enhancements seek to incorporate an analytical module, therefore enhancing the versatility of BioDOF-Map as a tool for effective fisheries management and decision-making.
Through the integration of many data sources for real-time geographic analysis, the BioDOF-Map system provides significant advantages such as decreased lead times, enhanced cross-collaboration, and reduced entry costs. This technology enables clients to remotely view web maps from any device, facilitating the publication of multilayer maps on a single platform. Issues such as data inconsistencies and technical barriers exist, particularly in rural locations where larger costs may be incurred. Notwithstanding these challenges, BioDOF-Map improves effectiveness by enabling the transfer of data between enterprises and local governments, encouraging interactive, self-service cartography, and assisting in strategic planning, facility building, and service delivery for the Department of Fisheries (DOF) in Malaysia.
REFERENCES
Smith, M. J., Otto, J. C., Moore, A. B., Grohmann, C. H., Hillier, J., & Geilhausen, M. (2022). Geovisualization. In Elsevier eBooks (pp. 319–361). https://doi.org/10.1016/b978-0-12-818234-5.00147-4.
Elwood, S., Goodchild, M. F., & Sui, D. Z. (2012). Researching Volunteered Geographic Information: Spatial Data, Geographic Research, and New Social Practice. Annals of the Association of American Geographers, 102(3), 571–590. https://doi.org/10.1080/00045608.2011.595657.
Buławka, N., & Chyla, J. (2020). Mobile GIS in Archaeology: Current Possibilities, Future Needs. Position Paper. HAL (Le Centre Pour La Communication Scientifique Directe). https://doi. org/10.15496/publikation-43226.
Campana, S. (2016). Sensing Ruralscapes. Third-Wave Archaeological Survey in the Mediterranean Area. In Quantitative methods in the humanities and social sciences (pp. 113–145). https://doi. org/10.1007/978-3-319-40658-9_6.
Wibisono, A. B., Artanto, A. T., Subiyantoro, H., & Priyambodo, M. (2020). Utilization of UI / UX Design as a Concrete Step in Products Marketing to Break the Middlemen / Wholesaler System at Klampar Batik SMEs (Case Study of CV Bintang Abadi Batik SMEs in Klampar Village). https:// doi.org/10.2991/assehr.k.200325.004